Telford TN Housing Market Trends | November 2026
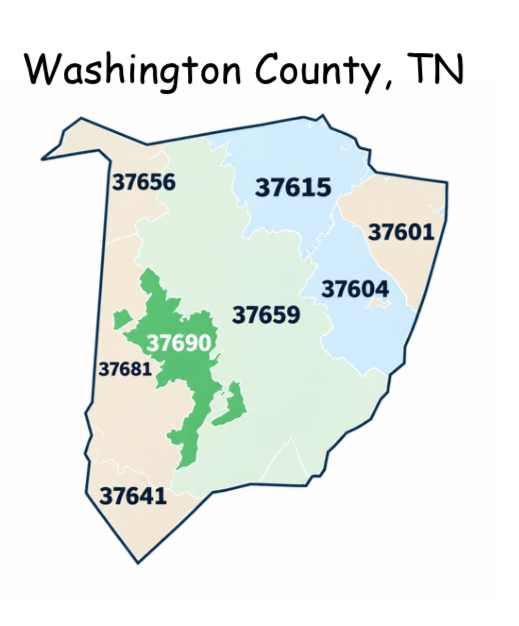
From 2022 to October 20, 2026, Washington County had a larger increase in its median sale price. Telford had a slightly larger increase in its median price per finished square foot. What does that mean for your home? These trends provide helpful background, but recent sales of similar homes offer a better starting point. I reviewed residential sales from the Tennessee/Virginia Regional MLS (TNVAR) to see how the two markets compare. In this article, “Telford” means ZIP code 37690. Washington County figures cover the whole county, including homes within the county’s part of that ZIP code.
Fewer Sales Can Mean Bigger Changes in the Numbers
In 2025, the MLS data reviewed showed:
-
Washington County: 1,938 residential sales.
-
Telford’s 37690 ZIP code: 50 residential sales.
The ZIP code’s sales total was about 2.6% of the county’s total, showing the large difference in the size of these two markets. With fewer home sales, each sale in Telford can have a greater effect on the numbers, moving them either higher or lower. Several large or recently updated homes could push the median price higher one year. More small homes or homes needing repairs could pull it lower the next.
That does not mean every home gained or lost value by the same amount. Broad market reports help us see overall trends, but the details of individual sales matter when choosing comparisons for your home. This is why a countywide report may not describe what is happening nearby. The familiar saying still applies: Location, location, location.
How Have Median Sale Prices Changed?
The median sale price is the middle price when all sales are listed from lowest to highest. Half the homes sold for more, and half sold for less. Here is how 2022 compares with the available 2026 data:
| Area | 2022 median sale price | 2026 median sale price* | Approximate increase |
|---|---|---|---|
| Telford (37690) | $265,000 | $304,000 | 15% |
| Washington County | $295,000 | $375,000 | 27% |
Figures are rounded. The comparison uses full-year 2022 sales and 2026 sales through October 20, so seasonal differences may affect the results.
What About Price per Finished Square Foot?
A home’s size affects its sale price. Price per finished square foot gives us another way to look at the market, and real estate agents often use it when comparing properties. It’s easy to calculate, but it can be misleading when used alone. Differences in land, condition, garages, pools, and other features can affect the price without changing the finished square footage.
Appraisers consider these differences when forming an opinion of value, but judgment still plays a role. Buyers and sellers make their own judgments, too. A sale can move forward when they agree on a price, even if they have different reasons for choosing it.
To calculate a home’s price per finished square foot, divide its sale price by its finished square footage. The chart below shows the median for each year: half the homes sold for more per finished square foot, and half sold for less.
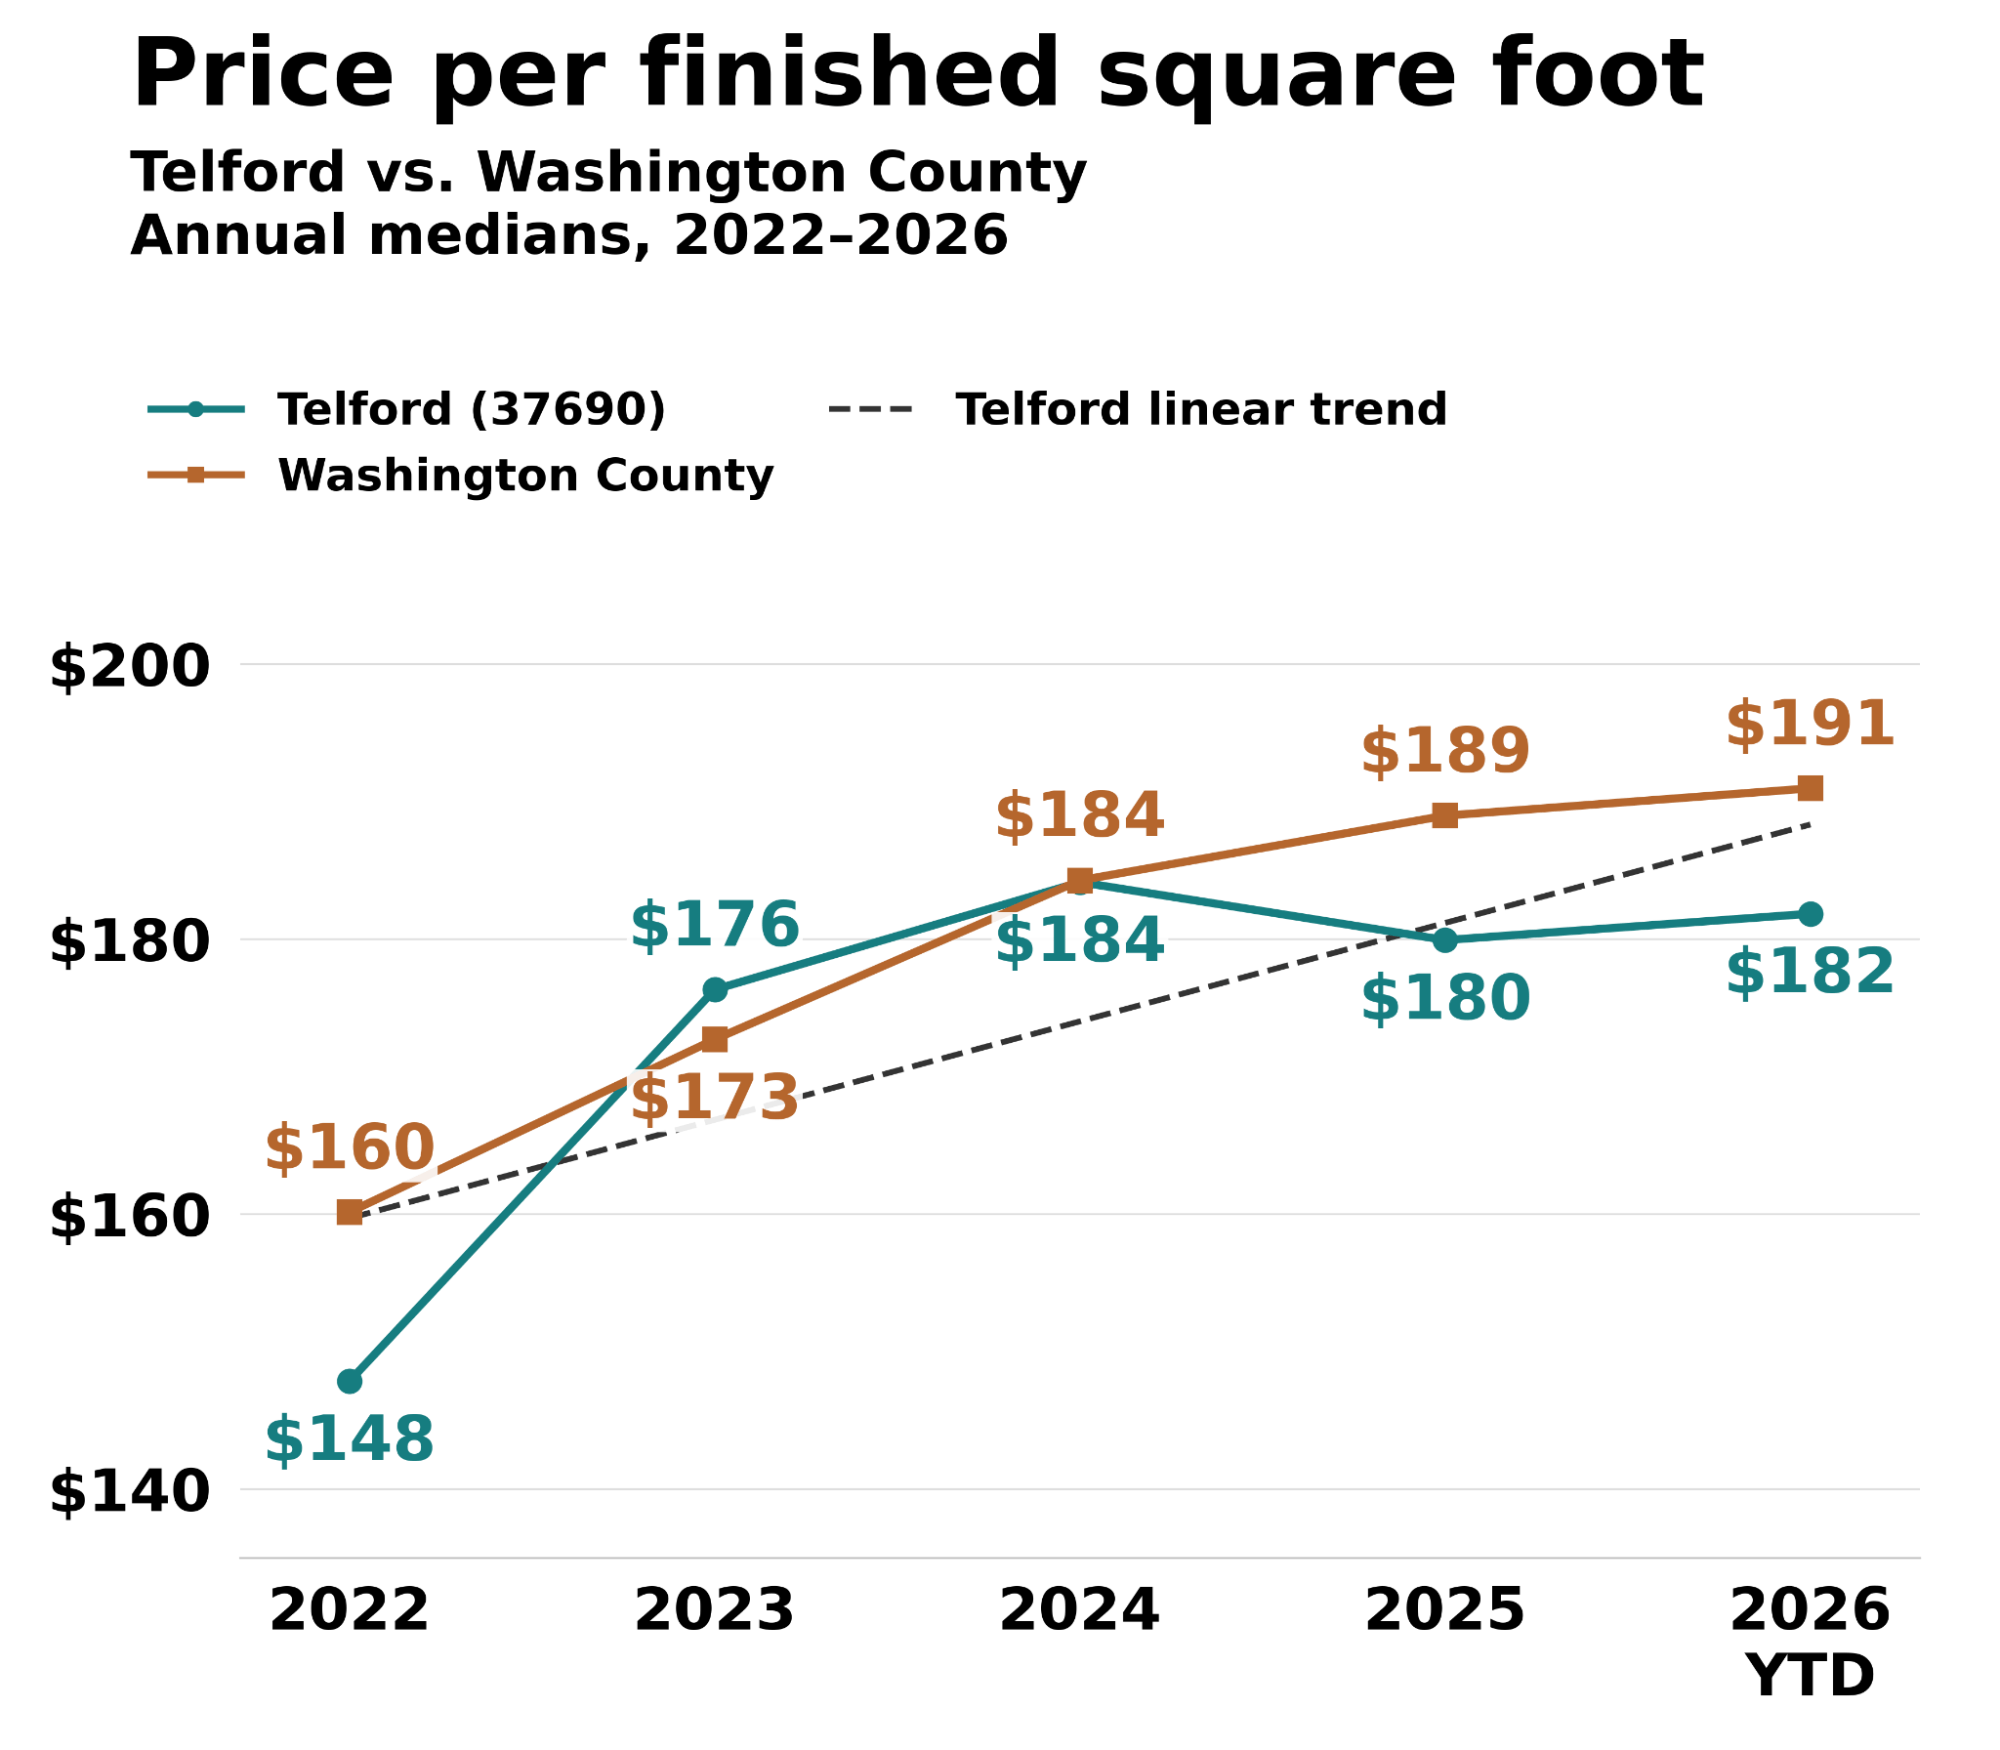
Dollars per finished square foot, rounded to the nearest dollar. 2026 sales through October 20; earlier years cover full calendar years.
From 2022 to the available 2026 data:
-
Telford’s median rose about 23%, from $148 to $182 per finished square foot.
-
Washington County’s median rose about 19%, from $160 to $191 per finished square foot.
Washington County’s figure rose each year shown. Telford’s rose through 2024, fell in 2025, and rose slightly in 2026. Washington County had the larger increase in median sale price, while Telford had the slightly larger percentage increase in median price per finished square foot. Both findings can be true because they measure different things. Telford’s prices per finished square foot were fairly close to the county’s throughout the period, but individual property values still depend on location, land, condition, and features.
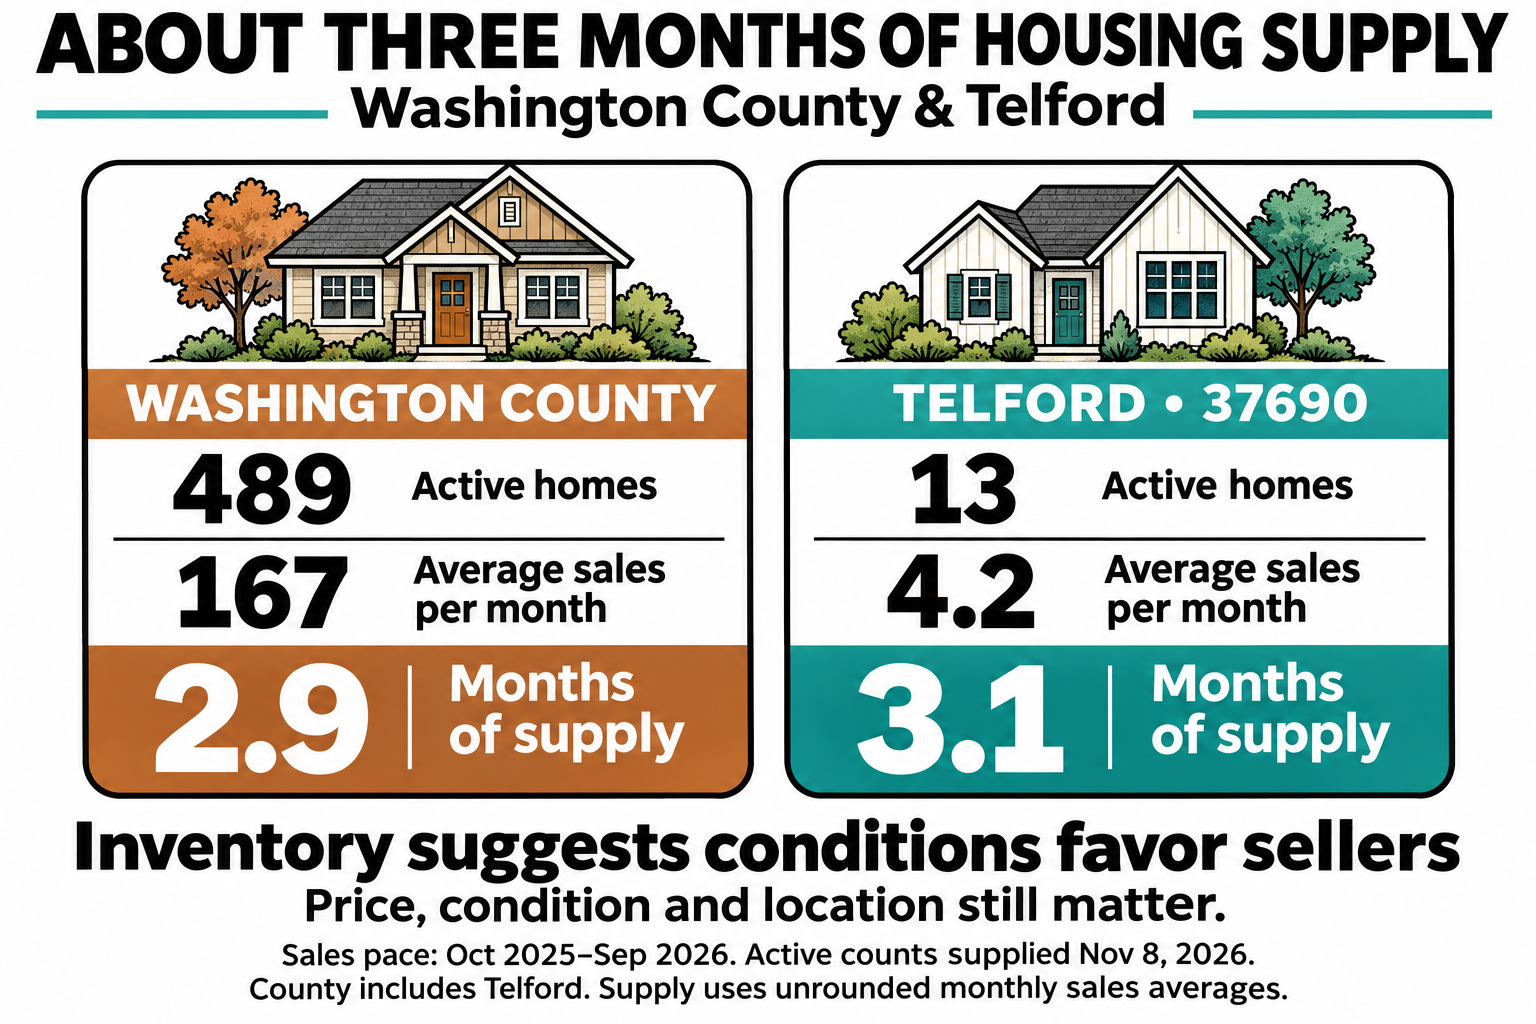
What Does This Mean for Your Home?
These numbers tell us more about the market as a whole than about your particular home. Rising prices across Washington County can be an encouraging sign, but the tide does not lift every property equally. Location, condition, and nearby competition still matter. Countywide trends help us see the bigger picture; recent sales of homes similar to yours help us understand where your home fits. We can compare those homes with your property and the homes currently for sale to find your place in the market. The area we study and the comparable properties we choose can change the picture, so those choices matter.
It’s natural to want to start with a higher asking price. Who wouldn’t want to sell for more? But a higher asking price does not always lead to a higher sale price. If there are few showings during the first couple of weeks, we should review the price, presentation, and competition. Buyer response helps us decide whether an adjustment makes sense.
The goal is to use the available evidence to set a price that attracts serious buyers. In the end, a sale depends on what a ready, willing, and able buyer will pay—and what the seller will accept.
Facts before decisions.
If you would like to see how these trends relate to your home, I’m happy to help you review recent comparable sales. No pressure or obligation—just useful information.